
TradingView Algo Scripts
Watch the installation video
How It Works
Step 1.
Access Via Tradingview
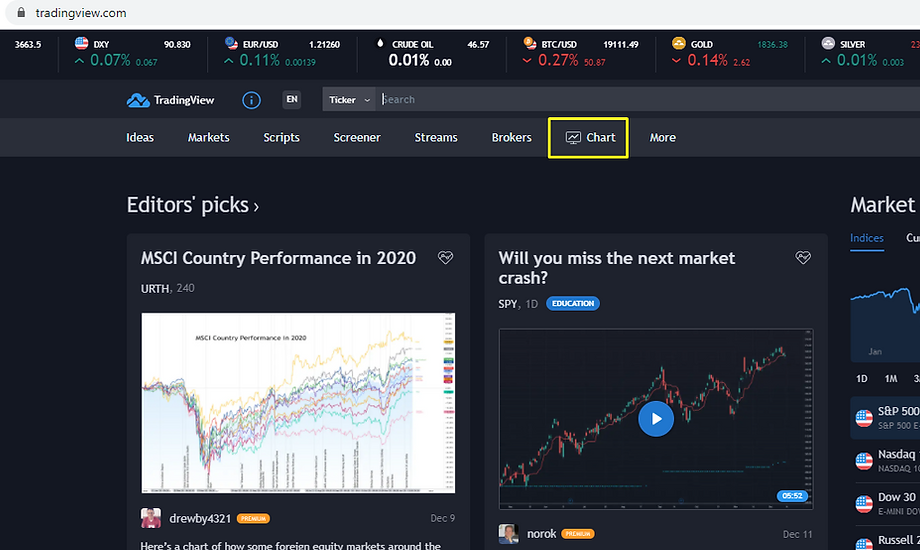
To access the application, go to tradingview.com and select the "chart" tab from the home page (link). From there, select the Indicators button on the top of the screen. You'll see an option for "Invite-only scripts", select "UltraAlgo".
If you do not see the "Invite-only script", please make sure that you open a ticket with support and send us your Tradingview Username. Click here to open a ticket.

Step 2.
Configuring View
[Chart Type] We recommend that customers use the Heikin Ashi chart.

[Time Period] This can be adjusted to reflect your trading strategy. We recommend a 5-minute view for default, but adjusting the time interval to longer period will allow customer to experience a broader view of general price movements.

[Nbr Of Standard Deviation] Adjust this multiplier on the standard deviation to trigger the Ultra Bull / Ultra Bear signals which reflect jumps in the security. This is usually a strong indicator of Institutional as they suggest if an abnormally large block of shares is being traded.
[Gain] This feature allows customers to adjust the indicators to match the volatility and frequency that a pattern is displayed across a stock. Generally, the lower ranges are designed for more aggressive price movements. We set the volatility to default at 6. It's recommended to limit adjusting the volatility from a minimum of 3 to a maximum of 15.

[High / Low Bands] One additional feature that was added includes the 20 and 3 Week highs and lows. This allows traders to quickly determine if the security is generally over extended without having to zoom in and out.

[Remove Back-Test] We recommend to remove the back-test from the display. Our signals fire faster than the back-test in TradingView and this clutters the chart display. To remove the back-test, mouse-over the script on the left of the screen and select the gear (Settings) icon. Select the Style tab on the pop-up and scroll to the bottom of the pop-up. Here you will un-check the 3 boxes: Trades on Chart, Signal Labels, Quantity.

Step 3.
Data Subscription
[Add Data Subscription] This will allow you to receive market data in real-time (the standard subscription delivers the data with up to 5 minutes delayed). Navigate to your Username on Tradingview and select "Account and Billing". Scroll half way down the page to "Extra Data Subscription" and Add NYSE ($2/month), OTC ($2/month) and NASDAQ ($2/month).
If you are trading Forex and Crypto, the additional data subscription is not required.


Software Requirements
Our algorithm currently lives on the Tradingview Platform. In order to begin you'll need to purchase a Pro license ($14.95 / Month). Tradingview offer a 30-day free trial for those not currently subscribed to the platform. Click here to begin your trial.
For Real-Time Trading, Data Subscriptions to NYSE ($2/month), NASDAQ ($2/month) and OTC ($2/month) are required. If you're trading Forex or Crypto the additional data subscriptions are not required.
Training Videos
Getting Started | Installation
Getting Started | Stock Scanner
Getting Started | Time to Trade
Getting Started | Stock Alerts
Live Trading | Crypto (ETH)