top of page


00:53

01:22

02:19

00:41

00:36

00:35

01:52

01:59

02:15

00:40

00:34

00:36

02:08

02:01

02:17

00:34

00:41

00:38

How The World's Best Hedge Fund Uses AI (Artificial Intelligence) To Beat The Market
How the Renaissance Technologies hedge fund beat the market for 15 consecutive years, making it one of the most successful funds of its time

Algorithmic Trading for TradingView
UltraAlgo offer algorithmic trading directly for TradingView. Our algorithm is powered by 15 technical indicators and optimized with AI

What Is Algo Crypto & How To Use For Trading?
Learn how to use an Algo Crypto to finding trading patterns across various coins such as: Bitcoin, Ethereum, Dogecoin and more.


Stock Trading Ideas $COIN / NASDAQ (Coinbase Global)
In the video we review stock trading ideas for $COIN / NASDAQ (Coinbase Global) with the algorithmic trading application from UltraAlgo.


What Is Max Pain (Options Trading)?
Max pain trading suggests a price direction that will result in the largest number of options expiring out of the money.


What Is Position Sizing When Trading? Is It Effective?
Position sizing refers to the process of determining the size or amount of an investment in a particular security or asset.


What Is Efficient Frontier? Does It Improve Portfolio Performance?
Efficient Frontier for stock trading represents the optimal trade-off between risk and return for a portfolio of assets.


What Are Volume Indicators (VWAP, OBV, CMF) for Stock Trading?
Volume indicators are technical analysis tools that use volume data to help traders and investors identify potential opportunities.
What Are Volatility Indicators (ATR, Bollinger Bands, Standard Deviation)?
Stock Trading Strategies Volatility indicators are technical analysis tools that aim to measure the size and frequency of price movements...
What Are Scale-Invariant Momentum Indicators?
Stock Trading Strategies Scale-invariant momentum indicators are technical analysis tools that are designed to identify trends in...
What Are Momentum Indicators?
Momentum indicators are technical analysis tools that are used to identify the strength and speed of a price move in a financial market.
What Are Trend Indicators?
Trend indicators can be a useful tool for traders, as they can help identify the direction and strength of a trend in a financial market.


What Is The Difference Between Market Depth and Level 2 Data?
Market depth and Level 2 are two terms that are often used in the context of stock trading and refer to different aspects of the order book
How To Use Market Depth For Trading Stocks?
Market depth is a measure of the number of orders available at different price levels for a particular security or market.


What Is A Robo-Advisor?
A robo-advisor is a digital platform or service that uses algorithms and automation to provide financial advice.


What Is Trading Profit Factor?
Stock Trading Strategies The trading profit factor is a measure of a trading system's profitability. It is calculated by dividing the...


How To Use Resistance & Support Lines For Trading?
Resistance and support lines are levels at which the price of a security is likely to encounter resistance as it rises (resistance).
Stock Trading Ideas $AAPL / NASDAQ (Apple, Inc)
Algorithmic Trading for Stocks In the chart we review stock trading ideas for $AAPL / NASDAQ (Apple, Inc.) with the algorithmic trading...

How To Create Alerts in TradingView?
TradingView offers real-time alerts based on various trading conditions. We explain how to setup alerts quickly.
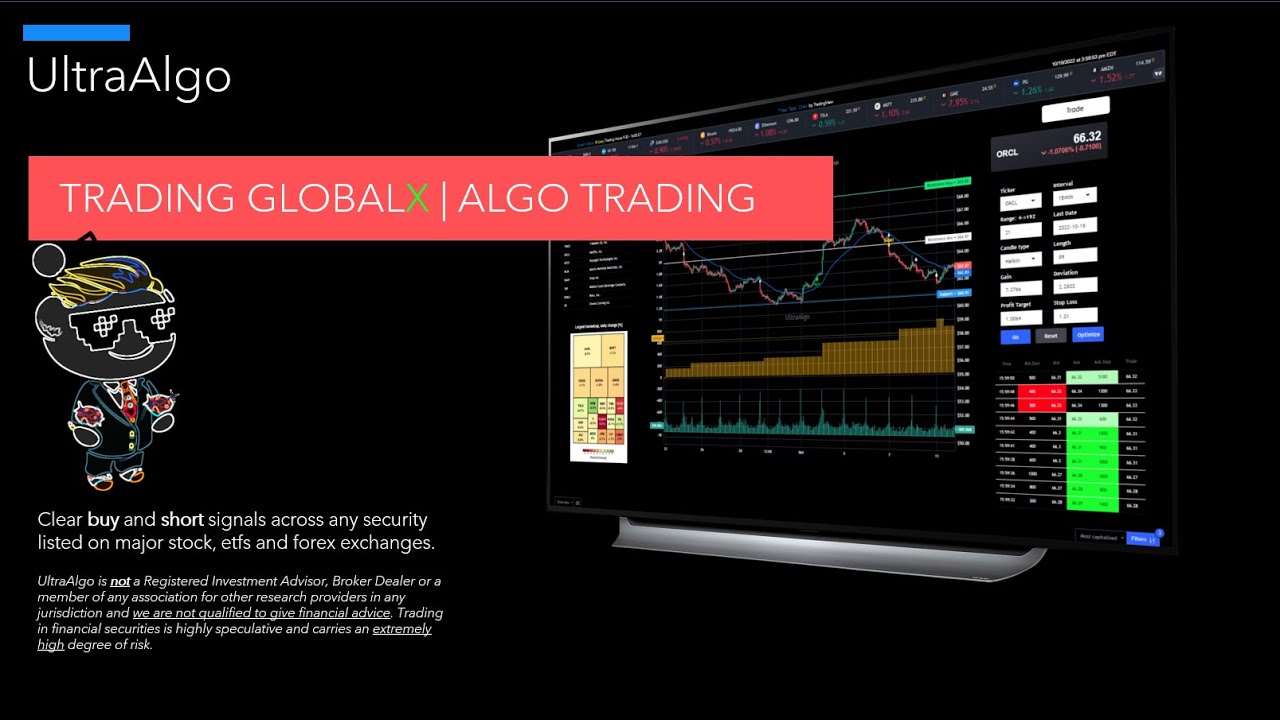
How To Trade GlobalX Leveraged ETFs? (QYLD, LIT, PAVE, XYLD, PFFV, RATE)
How to trade GlobalX with algo trading on both Leveraged & Inverse ETFs (such as QYLD, LIT, PAVE, XYLD, PFFV, RATE, AUSF).
bottom of page